

National context
- Government’s budget for education, learning and culture in 2025/26 is R508 billion, up from R482 billion in 2024/25. This represents 20% of the consolidated national government expenditure bill of R2.59 trillion. Of this, R332 billion (65%) is allocated to basic education, R48 billion to higher education, R14 billion to technical and vocational education and training and R55 billion to the National Student Financial Aid Scheme.
- President Cyril Ramaphosa signed the Basic Education Laws Amendment Bill into law in September 2024. In February 2025, Minister of Basic Education Siviwe Gwarube told Parliament the Act was fully operational. The Act aims to strengthen governance in South Africa’s education sector.
- During his 2025 State of the Nation Address, Ramaphosa announced that government was implementing Phase 1 of the Comprehensive Student Funding Model for Higher Education to address the needs of the ‘missing middle’. An additional 10 000 students were expected to be assisted by the end of the first year in 2025. In 2024, over 900 000 students from poor and working-class backgrounds received funding to study at universities and colleges.
- According to Gwarube, 724 156 out of 1.2 million learners who started Grade 1 in 2013 enrolled as full-time candidates for matric in 2024 (approximately 59%), indicating a high dropout rate and a high rate of learners who did not complete their basic education in 12 years. Of the 705 291 full-time candidates who wrote the 2024 exams, just over 87% passed, an increase of more than four percentage points from 82% in 2023.
- The pit latrines in over 93% of the 3 372 schools identified with them were replaced under the Sanitation Appropriate for Education (SAFE) initiative by March 2025. According to the Department of Basic Education (DBE), infrastructure backlogs remain: 13 655 schools need more toilets, 6 319 lack sustainable water and 8 265 need more classrooms. The DBE estimates that R129 billion is needed to address infrastructure backlogs by 2030.
- Phase 5 of the Basic Education Employment Initiative (BEEI) was launched in June 2025, creating 204 676 job opportunities for youth aged 18–34. Roles include education assistants, general school assistants, ICT eCadres, reading champions and infrastructure handypersons. This phase is funded by R4 billion from the Unemployment Insurance Fund (UIF) and R1.6 billion from National Treasury.
- The Thrive by Five Index 2024 found that only 42% of preschoolers are developmentally on track (see page 239 for more on the Index). The rand value of the early childhood development (ECD) subsidy increased for the first time since 2019, from R17 to R24 per child per day, which ECD systems change nonprofit Ilifa Labantwana estimates covers 66% of the total cost of providing quality early learning programme services.
- Education fees are surveyed annually in March, according to Statistics South Africa (Stats SA). The education price index increased by 4.5% in 2025, below the 6.4% rise in 2024. School fees increased by 5.0% (from 6.6% in 2024). Tertiary education institutions charged 3.7% more in 2025, down from 5.9% in 2024.
Overview of CSI spend
Education was supported by 91% of companies and received 44% of average CSI expenditure.
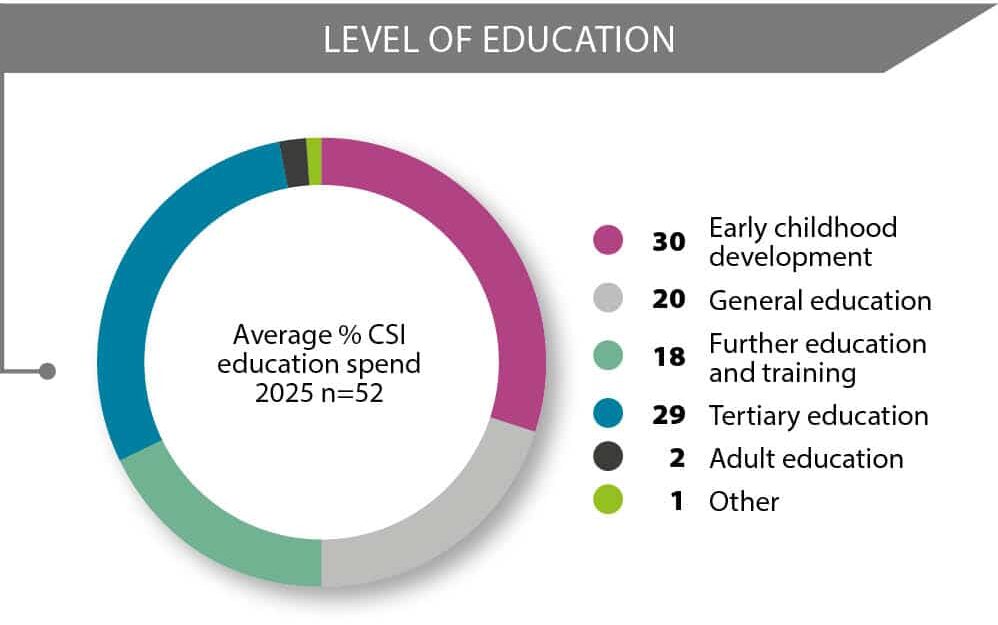
- Early childhood development (ECD) accounted for nearly a third (30%) of education spend on average, similar to 2024 (31%).
- Average expenditure on school-level education (general education plus further education and training) decreased slightly from 42% in 2024 to 38% in 2025.
- Tertiary education received an average of 29% of education spend, an increase from 23% in 2024 and 27% in 2023.
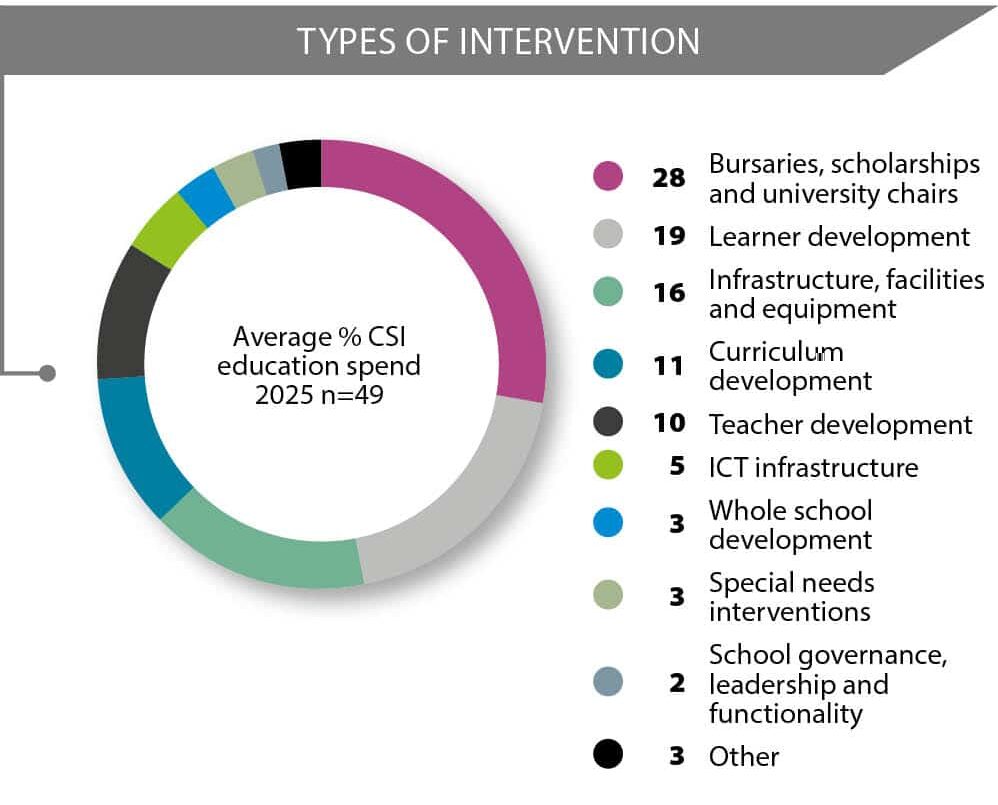
- Bursaries, scholarships and university chairs remained the most supported intervention type in the education sector, with average CSI education expenditure increasing slightly from 24% in 2024 to 28% in 2025.
- Learner development received the next highest average spend at 19%, almost double the 10% recorded in 2024.
- Infrastructure accounted for 16% of average CSI education spend, consistent with 2024.
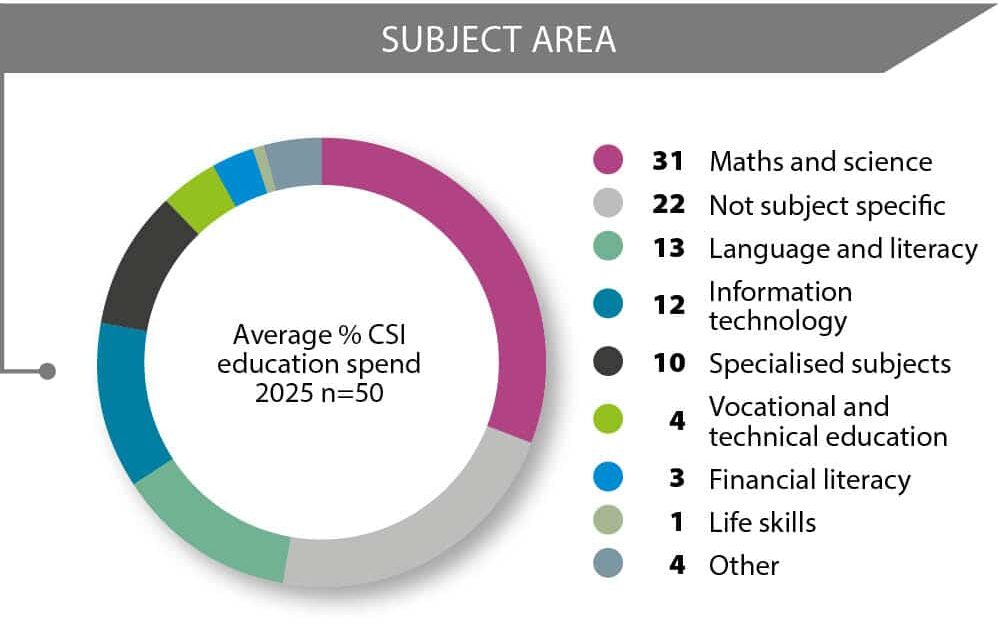
- On average, companies allocated the highest percentage of their CSI education budgets (31%) to maths and science, up from 24% in 2024. Maths and science returned to being the most funded subjects, consistent with survey results for more than a decade, except for 2023 when non-subject-specific funding topped the list.
- About a fifth of CSI education expenditure (22%) was not subject specific in 2025, compared with higher proportions in previous years (38% in 2024).
- Consistent with survey findings over the past two years, companies spent 13% of their CSI education budgets on language and literacy in 2025.
- There was a slight increase in funding for information technology from 7% of average CSI education spend in 2024 to 12% in 2025.
- Vocational and technical education (4%), financial literacy (3%) and life skills (1%) continued to receive the smallest share of average CSI education spend.
[CASE STUDY] Data dashboard drives education transformation
Monitoring and evaluation (M&E) often sits on the periphery of development work, seen more as an administrative necessity than as a tool for transformation. However, thoughtfully synthesised and strategically delivered data can be a catalyst for change. The South African education sector’s Data Driven Districts (DDD) dashboard programme is an example of how real-time data visualisation and targeted interventions can compress the data feedback loop, driving rapid sector improvements.
Leveraging data to drive interventions
The DDD programme, a partnership between the Department of Basic Education (DBE) and the Michael & Susan Dell Foundation, was launched in 2014. Implemented by nonprofit New Leaders Foundation (NLF), school-level data collected from the South African School Administration and Management System (SA-SAMS) is visualised on the DDD dashboard. This online tool presents key education metrics, such as attendance and learner progress, enabling educators to easily identify and address learning gaps. “Unlike M&E research that looks at trends, this kind of real-time data is what is needed to intervene in the moment,” says NLF Chief Executive Officer Catherine Nell.
NLF Chief Operations Officer Khodani Makatu adds that the dashboard was developed in response to the gap between data collection and its power to inform decision-making. “We saw that the data being collected was not able to deliver education reform.”
The dashboard enables users to view performance at multiple levels, from individual learners to entire districts. It allows for a drill-down into specific subjects and grades to quickly identify where interventions are needed. It also serves as a platform for educators to access support, including webinars, guides and videos.
As one of South Africa’s most extensive education databases, the DDD covers more than 24 000 schools serving 12 million learners, with over 15 000 active users processing 17 500 weekly database submissions.
The DDD five-step theory of change in action
The DDD’s impact unfolds through a five-step progression.
- The technology synthesises and analyses information that was previously trapped in provincial systems.
- Officials are trained on data use and interpretation, building a culture of data-driven decision-making.
- Role-specific dashboards are created for circuit managers, district officials, curriculum specialists and school management teams (SMTs)
- Officials learn to link data insights to actual education problems and devise targeted interventions.
- Real-time monitoring enables continuous course correction and impact measurement.
This systematic approach addresses common failure points in education programmes.
Data making a difference – The Pixley Ka Seme success story
Among the many examples of the DDD programme’s effectiveness, Nell and Makatu highlight the Pixley Ka Seme district in the Northern Cape as a notable success story. By using the dashboard, the district was able to improve its matric pass rate from 69% to 85% within three years.
“Through the dashboard and monitoring attendance for both learners and educators, it was easy to see where the issues were and identify that [the district] was not adhering to attendance and leave policies,” says Makatu.
Real-time monitoring enabled the district to enforce policy compliance, resulting in improved educator attendance. This translated to an 11% increase in National Senior Certificate results in 2024, making Pixley Ka Seme the most improved district in the country.
Nell says the dashboard’s ability to identify the range of issues affecting pupil performance has become indispensable.
Addressing system limitations
The DDD platform has its limitations, including those related to usage. Of the roughly 78 000 target officials in the education system, 49 000 are registered users, 35 000 have logged in over the past 24 months, but only 15 000 access the dashboard quarterly. “This drop-off between awareness and active use indicates that many officials use data for reporting rather than decision-making,” she comments.
Maintaining data quality at source is a further challenge. High attrition among school administrators, who are primarily responsible for data entry, means continuous training is needed to ensure consistent data capture.
The Valistractor system supports data quality by validating submissions before they enter the dashboard. Schools can only upload data once certain quality thresholds, such as learner and educator attendance data, are met.
Makatu acknowledges that certain important factors influencing learner success are beyond the scope of the dashboard. Measuring whether educators are delivering the prescribed lesson plans and assessing the quality of classroom delivery remain elusive tasks.
Moving with the times means embracing predictive analytics and personalisation
Looking ahead, the DDD is already implementing machine learning solutions, including models that predict learner promotion status based on past performance. “We started thinking about predictive analytics and machine learning in 2024 … We’re trying to leverage all the historical data and insights that we have to see if we can start predicting how learners are going to perform, so that we can identify those at risk early and provide the right support before it’s too late,” says Makatu.
Opportunities for corporate social investment
Nell and Makatu highlight that the dashboard’s success is rooted in partnerships between a government committed to systemic change and passionate mission-driven individuals. For companies seeking to make a transformational impact in education, supporting data-driven initiatives like the DDD offers a pathway to achieve evidence-based improvement at scale.
They list the ample opportunities for corporate social investment partners to build on the DDD programme, including supporting analytical work, investing in capability-building training programmes and developing evidence-based interventions using anonymised population-level data. Future partnership opportunities could also involve creating thematic data products aligned with national priorities – such as foundational literacy and numeracy, or science, technology, engineering and mathematics subjects – strengthening evaluation and impact measurement systems and contributing to the long-term sustainability of the platform through co-funding and research collaborations.
As South Africa’s education sector struggles to evolve, the DDD programme demonstrates how data can generate actionable insights, equipping committed education officials with the tools they need to transform the industry.